One of the most valuable yet often overlooked features of smart switches and plugs is their ability to monitor and report energy consumption. This capability transforms these devices from simple remote controls into powerful tools for understanding, managing, and optimizing your electricity usage. With energy costs rising and environmental concerns growing, the insights provided by smart energy monitoring can lead to significant financial savings and reduced environmental impact.
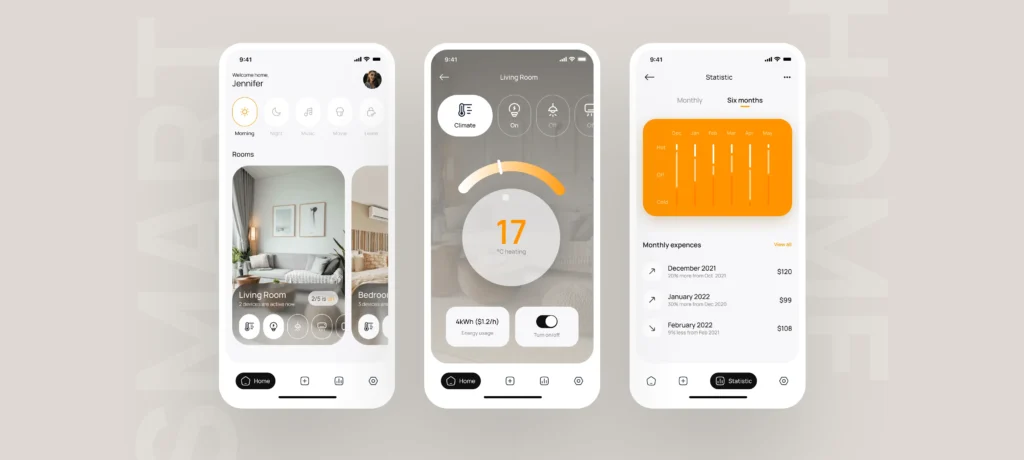
How Energy Monitoring Works
Smart switches and plugs with energy monitoring capabilities contain specialized components that measure electrical parameters in real-time.
Technical Foundation
Energy monitoring relies on several key components:
Current Sensors: These measure the amount of electricity flowing through the device at any moment, typically using small transformers or Hall effect sensors.
Voltage References: These establish the baseline voltage (usually 110-120V in North America or 220-240V in Europe) to calculate power consumption.
Microprocessors: These calculate power usage by combining current and voltage measurements, then integrate this data over time to determine energy consumption.
Communication Modules: These transmit the collected data to your smartphone app or home automation hub.
Measurement Accuracy
The precision of energy monitoring varies across different products:
High-End Devices (±1% accuracy): Provide laboratory-grade measurements suitable for detailed analysis and billing verification.
Mid-Range Devices (±3-5% accuracy): Offer reliable data for household management and identifying trends.
Basic Devices (±7-10% accuracy): Provide general estimates sufficient for identifying major energy consumers but not precise calculations.
Most consumer-grade smart plugs fall in the mid-range category, offering a good balance between accuracy and affordability.
Interpreting Power Consumption Data
Energy monitoring provides several types of data, each offering different insights into your electricity usage.
Key Metrics Explained
Real-Time Power (Watts): Shows instantaneous electricity consumption, like a speedometer for electricity. This measurement reveals how much power a device draws when operating.
Energy Consumption (Kilowatt-Hours): Represents cumulative electricity usage over time—the metric utility companies use for billing. One kilowatt-hour equals 1,000 watts used for one hour.
Usage Duration: Tracks how long devices have been active, helping identify items left on unnecessarily.
Cost Estimates: Many apps convert energy usage into approximate cost based on your electricity rates, making the financial impact immediately clear.
Historical Trends: Graphs and charts showing usage patterns over days, weeks, or months help identify anomalies and seasonal variations.
Reading the Data
To make sense of energy monitoring information:
Baseline Understanding: First, establish what “normal” looks like for each monitored device. Run appliances through typical cycles while observing power readings.
Identifying States: Many devices have distinct power signatures for different modes:
- A television might draw 150W when on, 5W in standby, and 0.5W when “off”
- A refrigerator cycles between 0W (off), 15W (idle), and 700W (cooling cycle)
- A laptop might show 60W when charging and processing, 30W when charged but running, and 0.5W when sleeping
Contextualizing Numbers: Power measurements become meaningful when compared:
- A modern LED bulb using 9W versus an old incandescent using 60W for the same brightness
- A space heater drawing 1,500W versus a heated blanket using 60W
- An old refrigerator using 600 kWh/year versus an ENERGY STAR model using 350 kWh/year
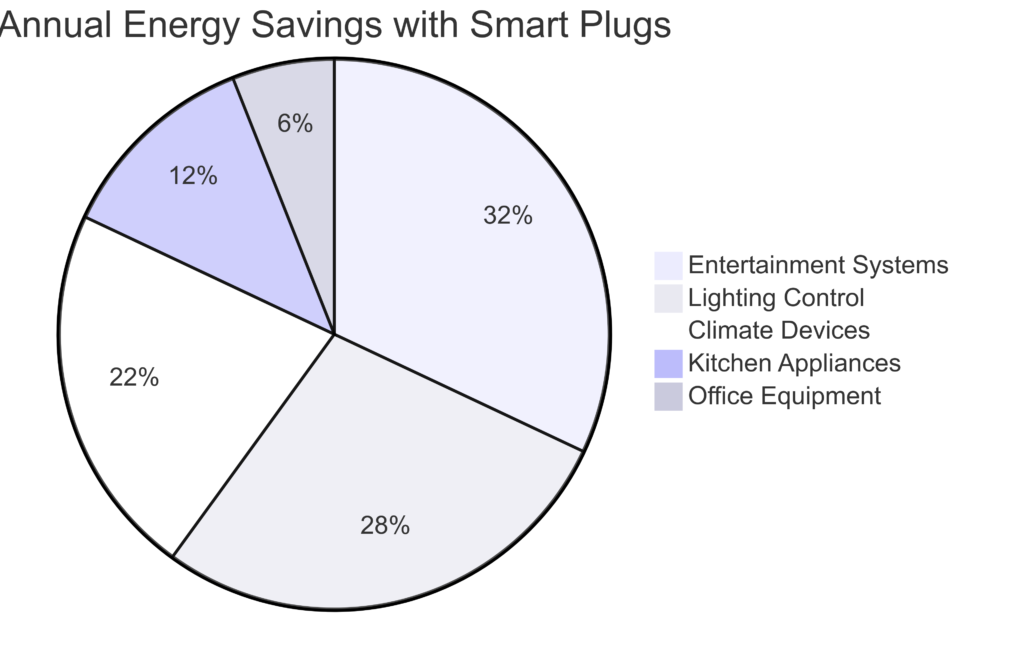
Energy Savings Data Visualization
Identifying Energy-Hungry Devices
One of the most immediate benefits of energy monitoring is discovering which devices consume disproportionate amounts of electricity.
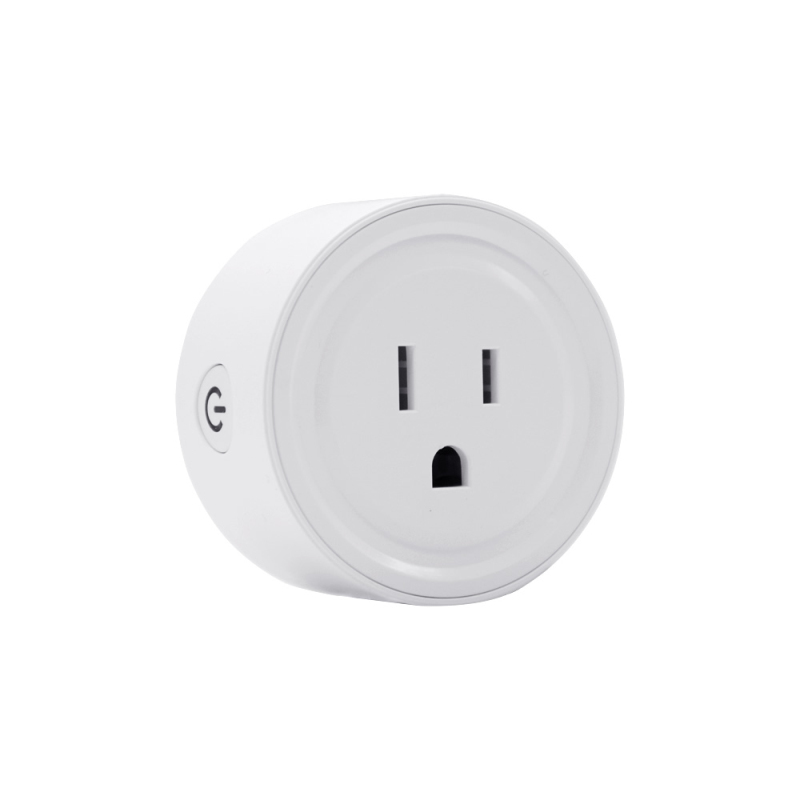
We offer Smart WiFi Plug 16A (US) with Energy Monitoring
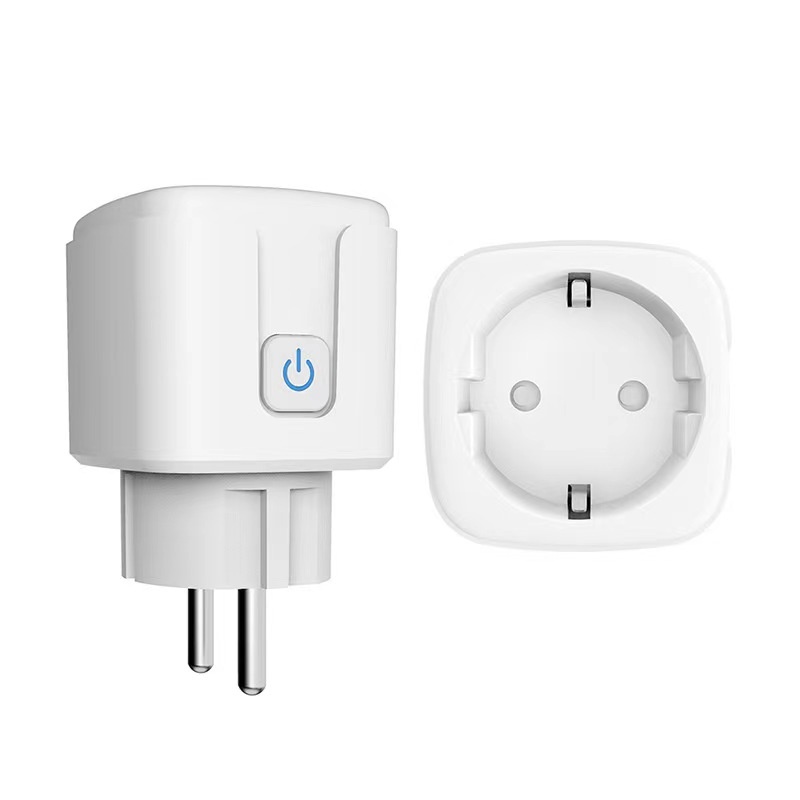
We offer Smart WiFi Socket 16A (EU) with Energy Monitoring
Common “Energy Vampires”
These devices often consume more power than owners realize:
Always-On Electronics: Devices that maintain constant power for instant-on capability or background processes:
- Cable/satellite boxes (15-35W continuous)
- Gaming consoles in standby mode (10-15W)
- Desktop computers in sleep mode (5-10W)
- Smart TVs with quick-start enabled (5-15W)
Aging Appliances: Older models often consume significantly more power than modern equivalents:
- Refrigerators over 10 years old (up to 50% more energy)
- Older plasma TVs (3-4 times the consumption of modern LED models)
- Aging space heaters with inefficient elements
- Old desktop computers with inefficient power supplies
High-Draw Devices: Items with heating elements or motors typically consume substantial power:
- Electric space heaters (1,000-1,500W)
- Hair dryers (1,200-1,800W)
- Toaster ovens (1,200-1,400W)
- Window air conditioners (500-1,500W)
Surprise Offenders
Energy monitoring often reveals unexpected power consumers:
“Phantom” or Standby Power: Many devices continue drawing power when seemingly off:
- Phone chargers left plugged in (0.5-2W)
- Microwave ovens with digital displays (3-5W)
- Printers in standby mode (3-8W)
- Audio equipment with “instant on” features (5-15W)
Malfunctioning Devices: Equipment operating incorrectly often shows abnormal power patterns:
- Refrigerators with failing door seals (more frequent cooling cycles)
- HVAC systems with clogged filters (longer run times)
- Water heaters with sediment buildup (increased heating duration)
- Devices with internal shorts or failing components
Calculating Potential Savings
Energy monitoring data allows you to quantify potential savings from behavioral changes or device replacements.
Financial Impact Assessment
To calculate the cost of operating any device:
- Determine Daily Energy Use:
- For continuous usage: Power (W) × 24 hours ÷ 1,000 = daily kWh
- For intermittent usage: Power (W) × hours used ÷ 1,000 = daily kWh
- Calculate Monthly Cost:
- Daily kWh × 30 days × electricity rate ($/kWh) = monthly cost
- Project Annual Expense:
- Monthly cost × 12 = annual operating cost
- Estimate Replacement Savings:
- Annual cost of old device – annual cost of new device = yearly savings
- Purchase price of new device ÷ yearly savings = payback period in years
Real-World Savings Examples
These calculations reveal meaningful savings opportunities:
Entertainment Center Standby Power:
- 5 devices drawing average 8W each in standby = 40W continuous
- 40W × 24 hours × 365 days ÷ 1,000 = 350.4 kWh/year
- At $0.15/kWh: 350.4 kWh × $0.15 = $52.56 annual cost
- Using smart plugs to eliminate standby power when not in use could save $40+ annually
Refrigerator Replacement:
- Old model: 600 kWh/year × $0.15/kWh = $90/year
- ENERGY STAR model: 350 kWh/year × $0.15/kWh = $52.50/year
- Annual savings: $37.50
- $900 new refrigerator ÷ $37.50 annual savings = 24-year payback
- However, including utility rebates and improved food preservation can significantly improve this calculation
Space Heating Optimization:
- 1,500W space heater running 6 hours daily in winter (120 days)
- 1,500W × 6 hours × 120 days ÷ 1,000 = 1,080 kWh
- At $0.15/kWh: 1,080 kWh × $0.15 = $162 seasonal cost
- Using smart plugs for scheduling and temperature-based automation can reduce usage by 30%, saving approximately $50 per heating season
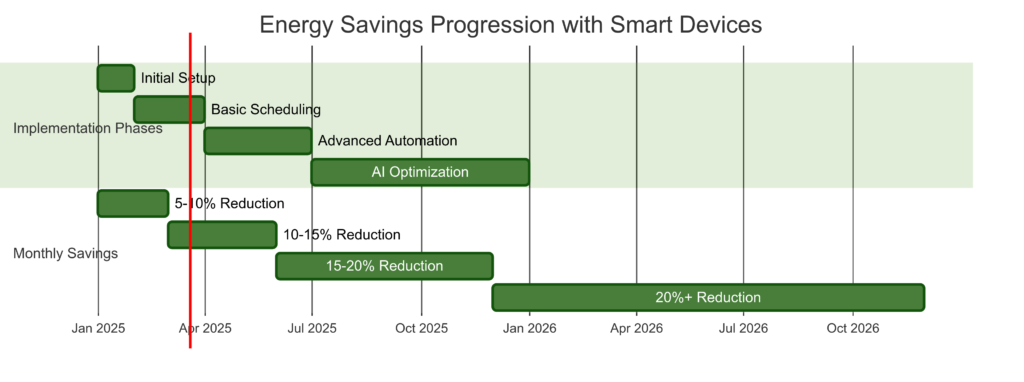
Energy Savings Over Time Chart
Advanced Energy Analysis Techniques
Beyond basic monitoring, several analytical approaches can provide deeper insights.
Usage Pattern Recognition
Identifying patterns helps optimize energy use:
Time-of-Day Analysis: Determine when devices consume most power:
- Morning usage spikes might indicate opportunity for scheduled delays
- Evening consumption patterns might benefit from peak-hour avoidance
- Overnight usage often reveals unnecessary always-on devices
Day-of-Week Patterns: Compare weekday versus weekend consumption:
- Significant differences suggest automation opportunities
- Consistent usage regardless of occupancy indicates waste
- Regular weekly spikes might correlate with specific activities
Seasonal Variations: Track how energy use changes throughout the year:
- Cooling and heating cycle changes
- Lighting duration adjustments with daylight changes
- Holiday-related consumption increases
Comparative Benchmarking
Contextualizing your usage against references provides perspective:
Historical Self-Comparison: Compare current usage to your own past patterns:
- Year-over-year same month comparisons
- Before/after efficiency upgrade measurements
- Impact assessment of behavioral changes
Peer Benchmarking: Some utilities and energy monitoring platforms offer anonymized comparison data:
- Similar-sized homes in your area
- Households with comparable occupancy
- Properties with similar construction
Standard References: Industry benchmarks for typical consumption:
- Average refrigerator: 350-780 kWh/year
- Electric water heater: 3,000-5,000 kWh/year
- Central air conditioning: 3,000-5,000 kWh/year (varies by climate)
- Lighting: 5-10% of total home energy use with LED technology
Implementing Energy-Saving Strategies
Energy monitoring insights enable targeted efficiency improvements.
Device-Specific Optimizations
Different devices benefit from different approaches:
For High-Standby Devices:
- Use smart plugs to completely power down when not in use
- Group similar devices on a single controllable circuit
- Schedule power-off periods during typical non-use hours
For Heating/Cooling Equipment:
- Implement temperature-based automation rules
- Create schedules aligned with occupancy
- Use geofencing to prevent heating/cooling empty homes
For Lighting Systems:
- Track usage to identify opportunities for motion sensors
- Analyze patterns to optimize scheduling
- Compare different bulb types to quantify LED upgrade benefits
Behavioral Adjustments
Small habit changes can yield significant savings:
Usage Timing Shifts:
- Run high-consumption appliances during off-peak rate hours
- Stagger the operation of multiple high-draw devices
- Align energy-intensive activities with solar production if you have panels
Maintenance Improvements:
- Clean refrigerator coils when monitoring shows efficiency decline
- Replace HVAC filters when runtime increases for same temperature change
- Address unusual power signatures that might indicate pending failure
Conscious Consumption:
- Power down devices manually when monitoring reveals significant standby draw
- Adjust thermostat settings based on actual energy impact data
- Choose lower-power device options when usage patterns show minimal benefit from higher-consumption modes
Privacy and Security Considerations
Energy monitoring data can reveal sensitive information about home occupancy and habits.
Data Protection Awareness
Understanding what your energy data reveals:
Occupancy Patterns: Power usage clearly shows when people are home and their daily routines
Lifestyle Insights: Usage patterns reveal sleeping schedules, cooking habits, work-from-home days, and more
Specific Activities: Detailed monitoring can identify when you’re watching TV, doing laundry, or using exercise equipment
Security Best Practices
Protecting your energy consumption data:
Account Security: Use strong, unique passwords for energy monitoring accounts and enable two-factor authentication when available
Data Sharing Controls: Review and limit what information your devices share with manufacturers
Local Processing: When possible, choose systems that process data locally rather than sending everything to cloud servers
Regular Updates: Keep monitoring devices updated with the latest firmware to address security vulnerabilities
Energy monitoring transforms smart switches and plugs from convenience gadgets into powerful tools for understanding and optimizing your home’s electricity consumption. By leveraging these insights, you can make informed decisions that reduce waste, lower utility bills, and minimize environmental impact—all while maintaining or even improving your quality of life through smarter energy use.
